Year 6 Maths (Spring Term 2nd Half)

Year 6 maths spring term 2nd half worksheets, printables, online games, links and other resources.

Fractions, Decimals and Percentages

Pupils should be taught to:

♦ associate a fraction with division and calculate decimal fraction equivalents [for example, 0.375] for a simple fraction [for example, 3/8 ]
♦ solve problems involving the calculation of percentages [for example, of measures and such as 15% of 360] and the use of percentages for comparison
♦ recall and use equivalences between simple fractions, decimals and percentages, including in different contexts

What is a percentage?

Information, videos and activities about percentages from BBC Bitesize.

How to Calculate Percentage

Information, videos and activities about calculating percentages from BBC Bitesize.

Convert Fractions into Percentages

Information, videos and activities about converting fractions into percentages from BBC Bitesize.

Compare Fractions, Decimals and Percentages

Information, videos and activities about comparing fractions, decimals and percentages from BBC Bitesize.

Area, Perimeter and Volume

Pupils should be taught to:

♦ recognise that shapes with the same areas can have different perimeters and vice versa
♦ recognise when it is possible to use formulae for area and volume of shapes
♦ calculate the area of parallelograms and triangles
♦ calculate, estimate and compare volume of cubes and cuboids using standard units, including cubic centimetres (cm³) and cubic metres (m³), and extending to other units [for example, mm³ and km³]

How to work out an area

Information, videos and activities about area from BBC Bitesize.

How to work out the area of a triangle?

Information, videos and activities about the area of triangles from BBC Bitesize.

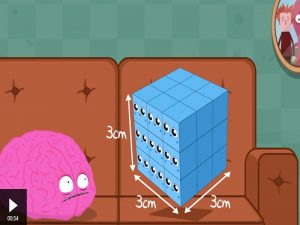
What is volume?

Information, videos and activities about volume from BBC Bitesize.

How to Calculate Volume

Information, videos and activities about calculating volume from BBC Bitesize.

Statistics

Pupils should be taught to:

♦ interpret and construct pie charts and line graphs and use these to solve problems
♦ calculate and interpret the mean as an average

How can data be displayed?

Information, videos and activities about displaying data from BBC Bitesize.

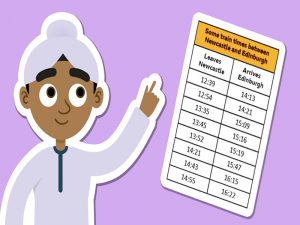
Interpreting Timetables

Information, videos and activities about timetables from BBC Bitesize.